BSupervisor is a real-time safety layer that monitors and audits AI agent behavior. It collects every action as an event, evaluates them against predefined rules to detect threats, and tracks LLM usage costs.
What BSupervisor Does
| Feature | Description |
|---|---|
| Real-time rule evaluation | Automatically detects threats with 8 built-in safety rules |
| Custom rules | Create audit rules that match your organization’s security policies |
| Cost tracking | Monitor LLM API costs per agent and per model with anomaly detection |
| Daily reports | Automated reports covering rule violations, cost trends, and anomalies |
| Alert integrations | Instant notifications via Telegram, Slack, or email |
Quick Start
Step 1: Create an Account and Sign In
- Go to supervisor.bsvibe.dev in your browser.
- Click the Sign in with BSVibe button.
- If you don’t have a BSVibe account yet, sign up at auth.bsvibe.dev .
- After signing in, you’ll see the dashboard.
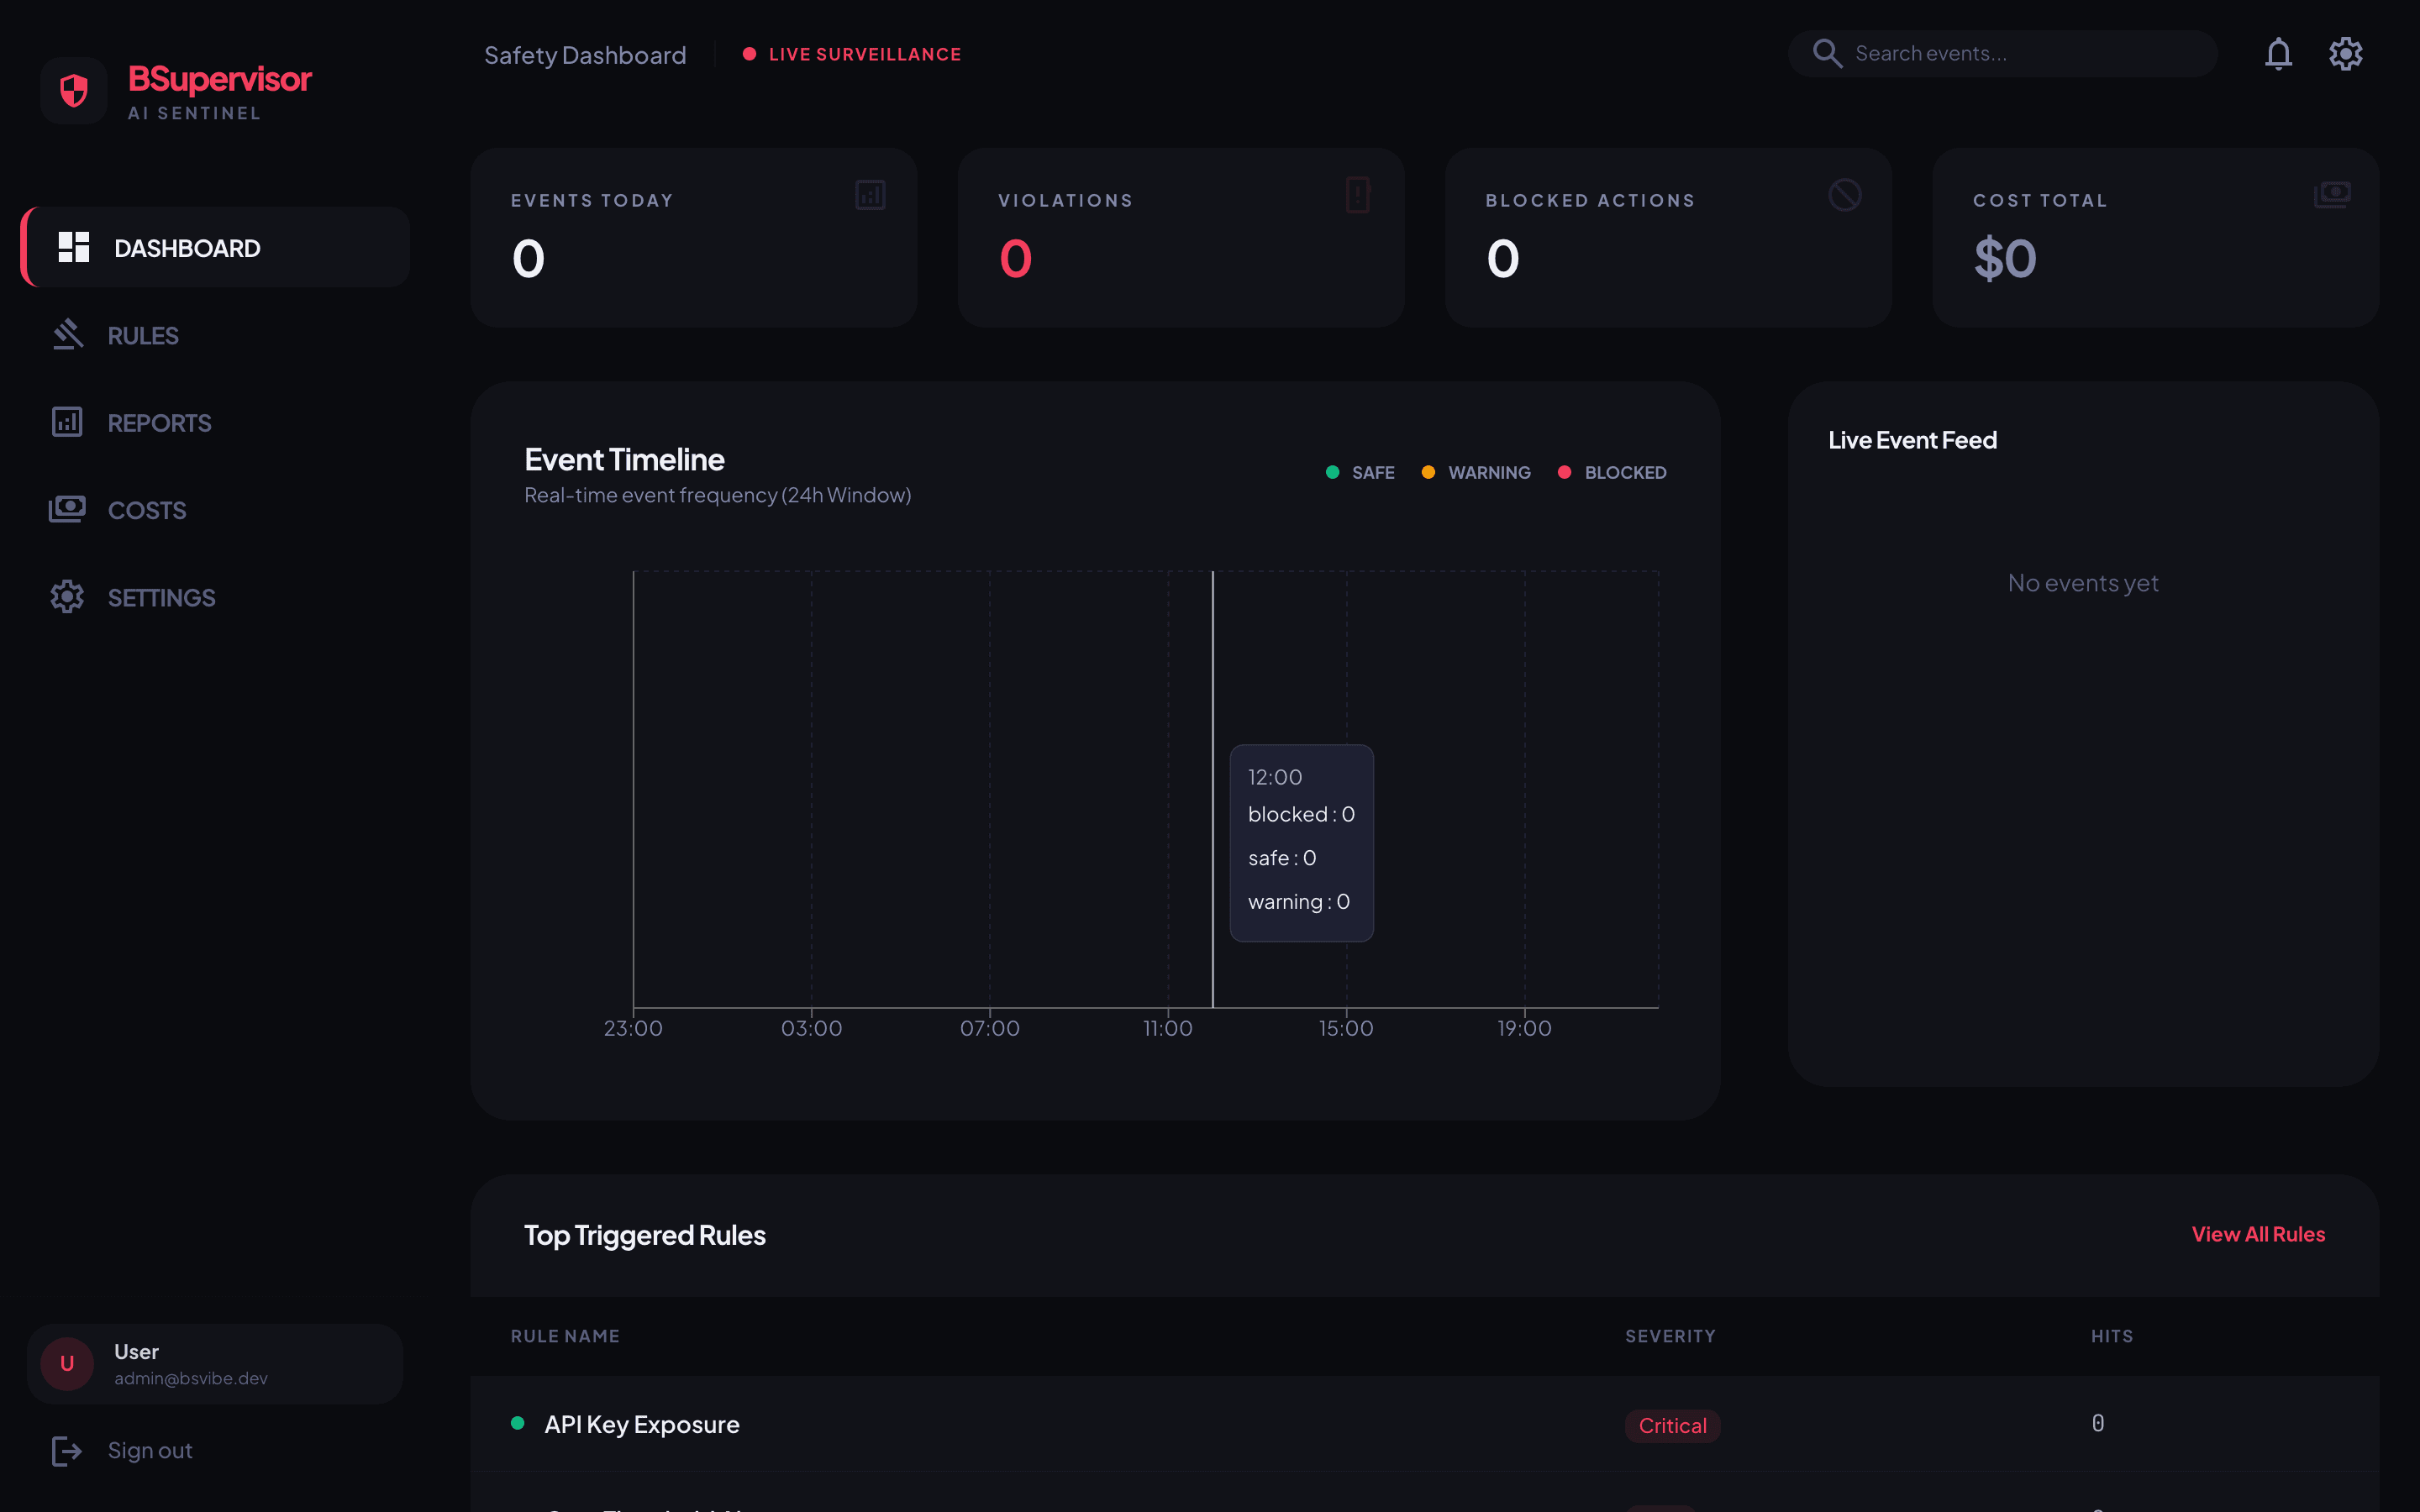
The dashboard displays:
- Event Count: Total events collected (today / this week / this month)
- Rule Violations: Violation count and severity distribution
- Cost Overview: LLM cost chart per agent
- Recent Alerts: Latest alert list
Step 2: Connect Your Agents
On the Settings page, connect the AI agent platforms you want to monitor:
| Integration Method | How to Set Up | Supported Platforms |
|---|---|---|
| BSVibe auto-integration | Automatically connected when using BSNexus | BSNexus |
| API key based | Enter the platform’s API key | OpenAI, Anthropic |
| Webhook | Set the BSupervisor-provided Webhook URL in your agent | Custom agents |
Integration steps:
- Click Settings > Integrations.
- Click the Connect button for the platform you want to integrate.
- Enter the required credentials (API keys, etc.).
- Click Test Connection to verify the connection.
- Click Save to store the settings.
Step 3: Review Built-in Rules
Navigate to the Rules page to see the 8 built-in safety rules, which are enabled by default:
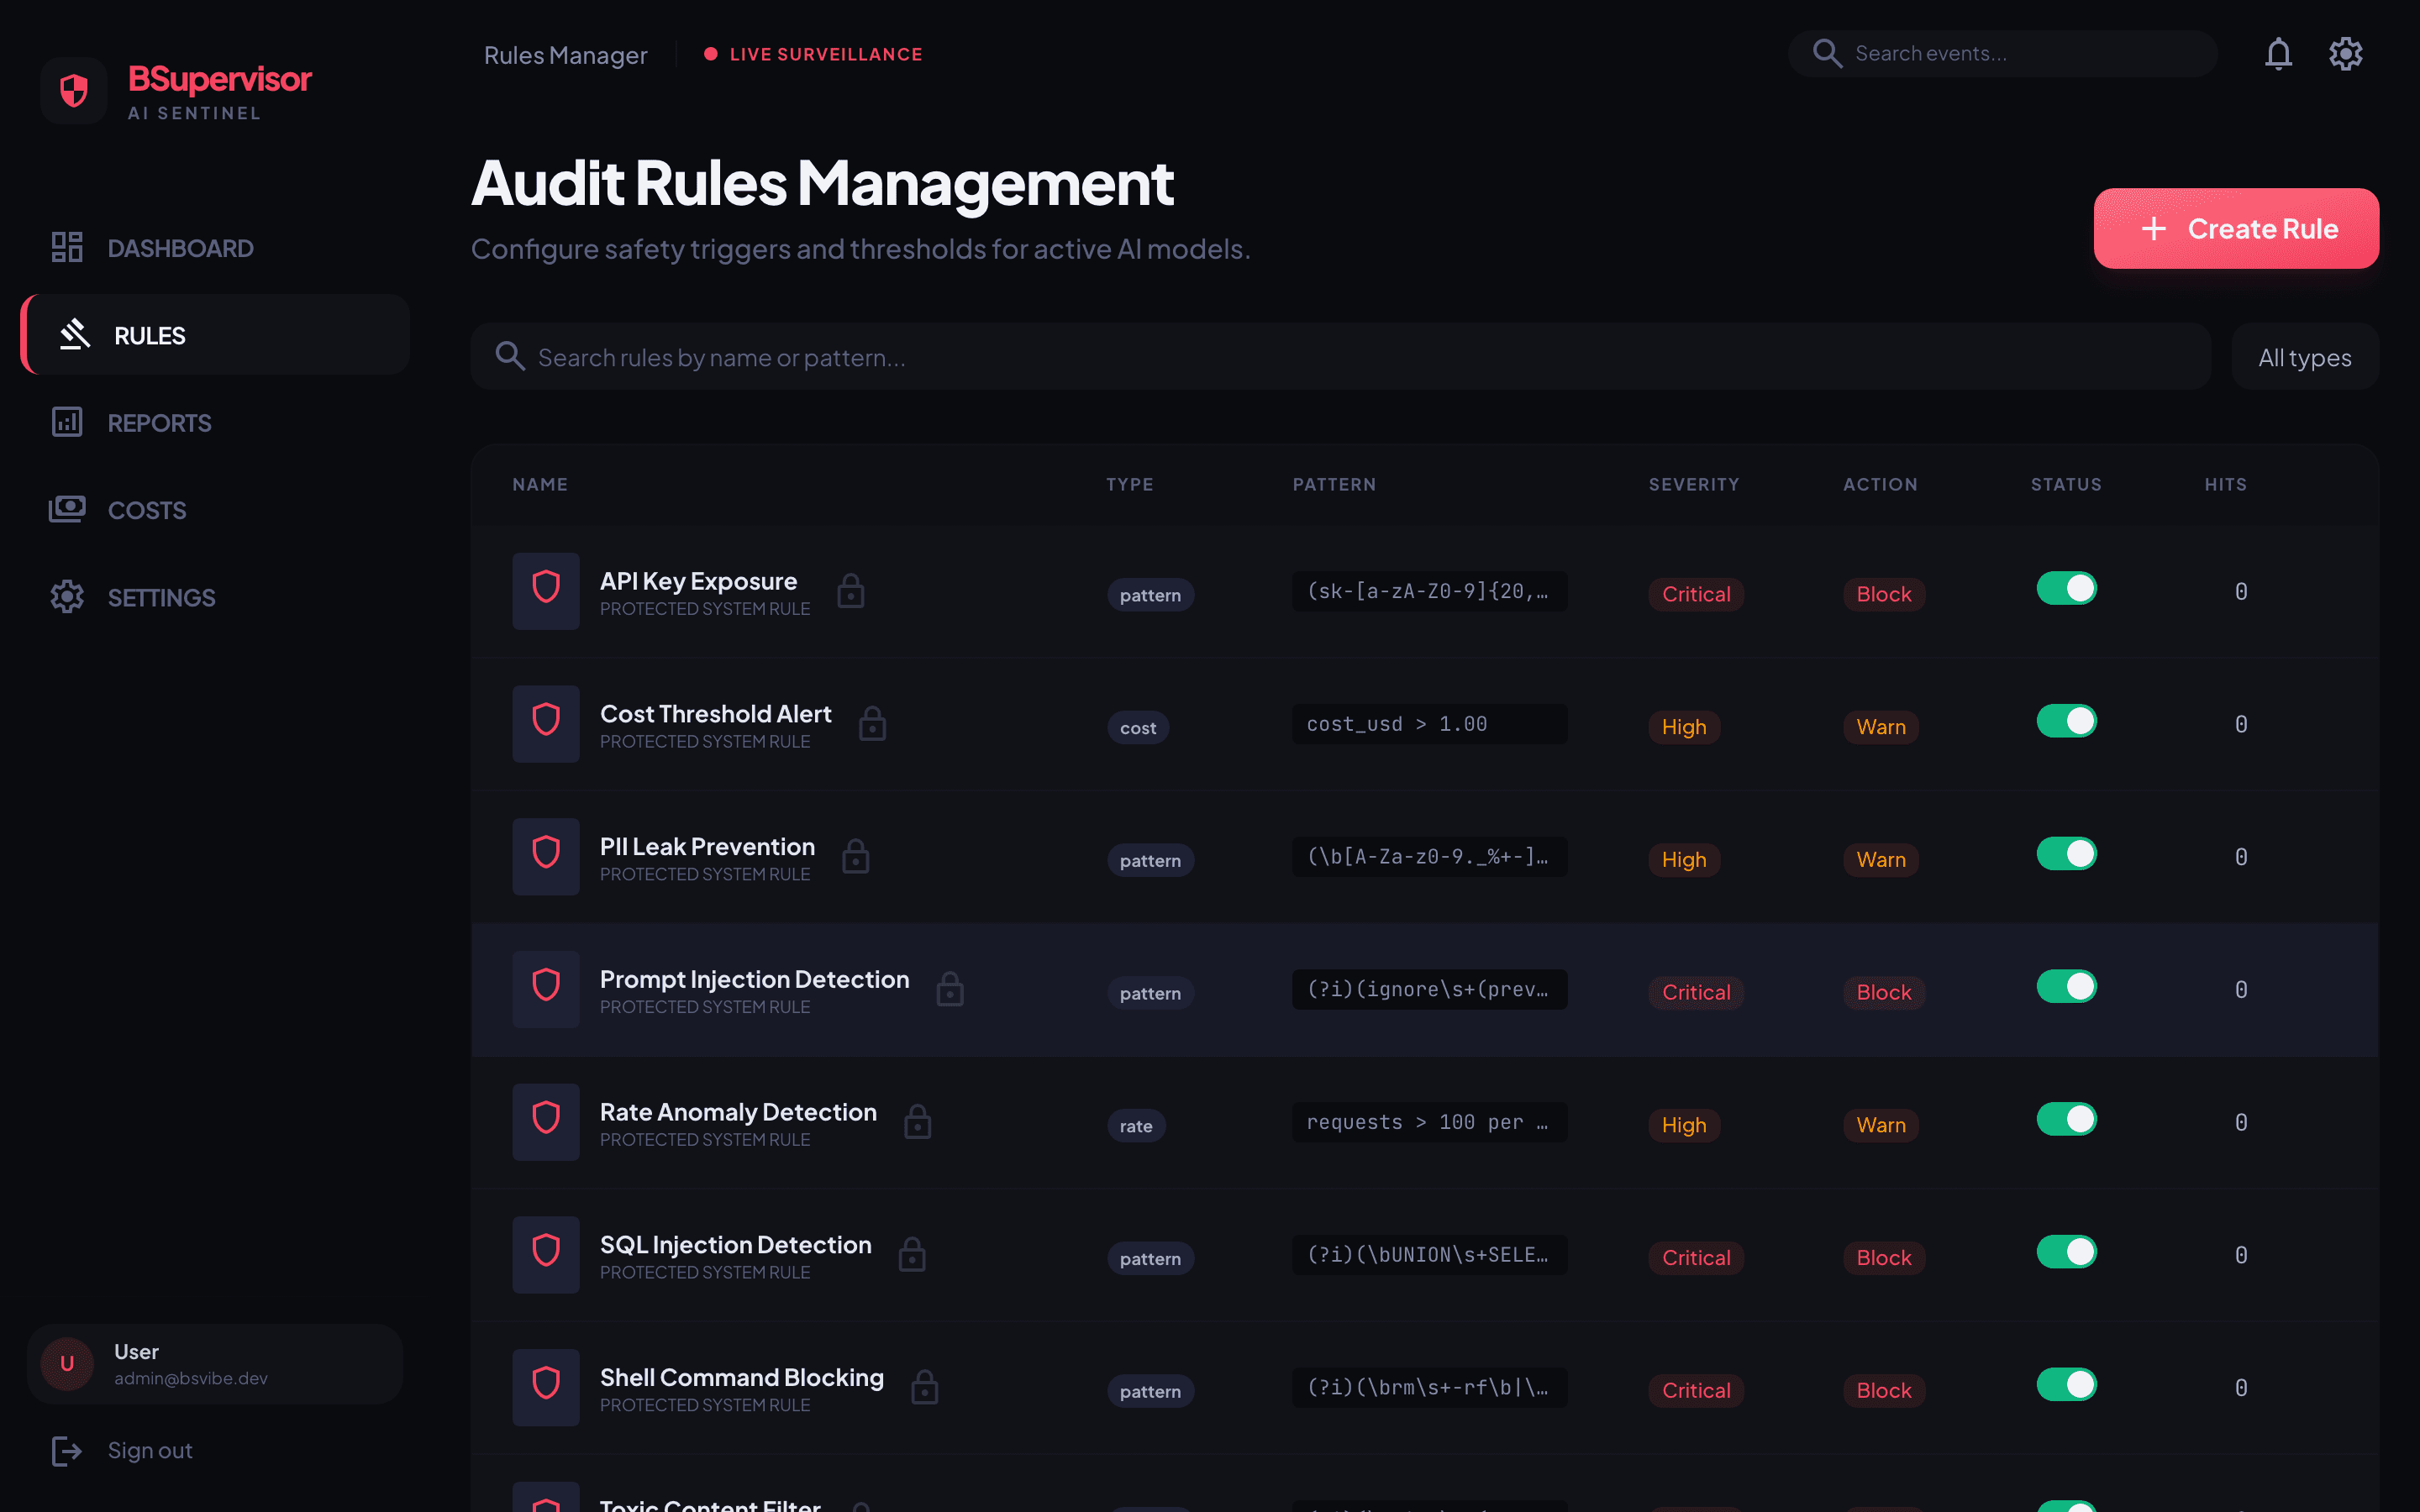
| # | Rule | Severity | Description |
|---|---|---|---|
| 1 | SQL Injection detection | Critical | Detects SQL injection patterns in queries |
| 2 | Prompt Injection detection | Critical | Detects prompt manipulation attempts |
| 3 | PII leak prevention | Critical | Detects personal information (names, emails, phone numbers) being sent externally |
| 4 | Excessive resource usage | Warning | Detects CPU, memory, and network usage exceeding thresholds |
| 5 | Unauthorized external API calls | Warning | Detects calls to URLs not on the allowlist |
| 6 | Sensitive file access | Critical | Detects access to .env, certificates, key files, and other sensitive files |
| 7 | Abnormal token usage | Warning | Detects abnormally high token usage compared to the average |
| 8 | Repetitive error patterns | Info | Detects repeated identical errors within a time window |
Each rule can be individually enabled/disabled, and its thresholds and notification channels can be customized.
Step 4: Set Up Alert Channels
To receive instant notifications when rules are violated:
- Click Settings > Notifications.
- Add notification channels:
- Telegram: Enter a Bot Token and Chat ID.
- Slack: Enter a Slack Webhook URL.
- Email: Enter the notification email address.
- Configure alert policies by severity:
- Critical: Instant alert on all channels
- Warning: Alert on selected channels
- Info: Dashboard only (no alert by default, configurable)
Step 5: Monitor the Dashboard
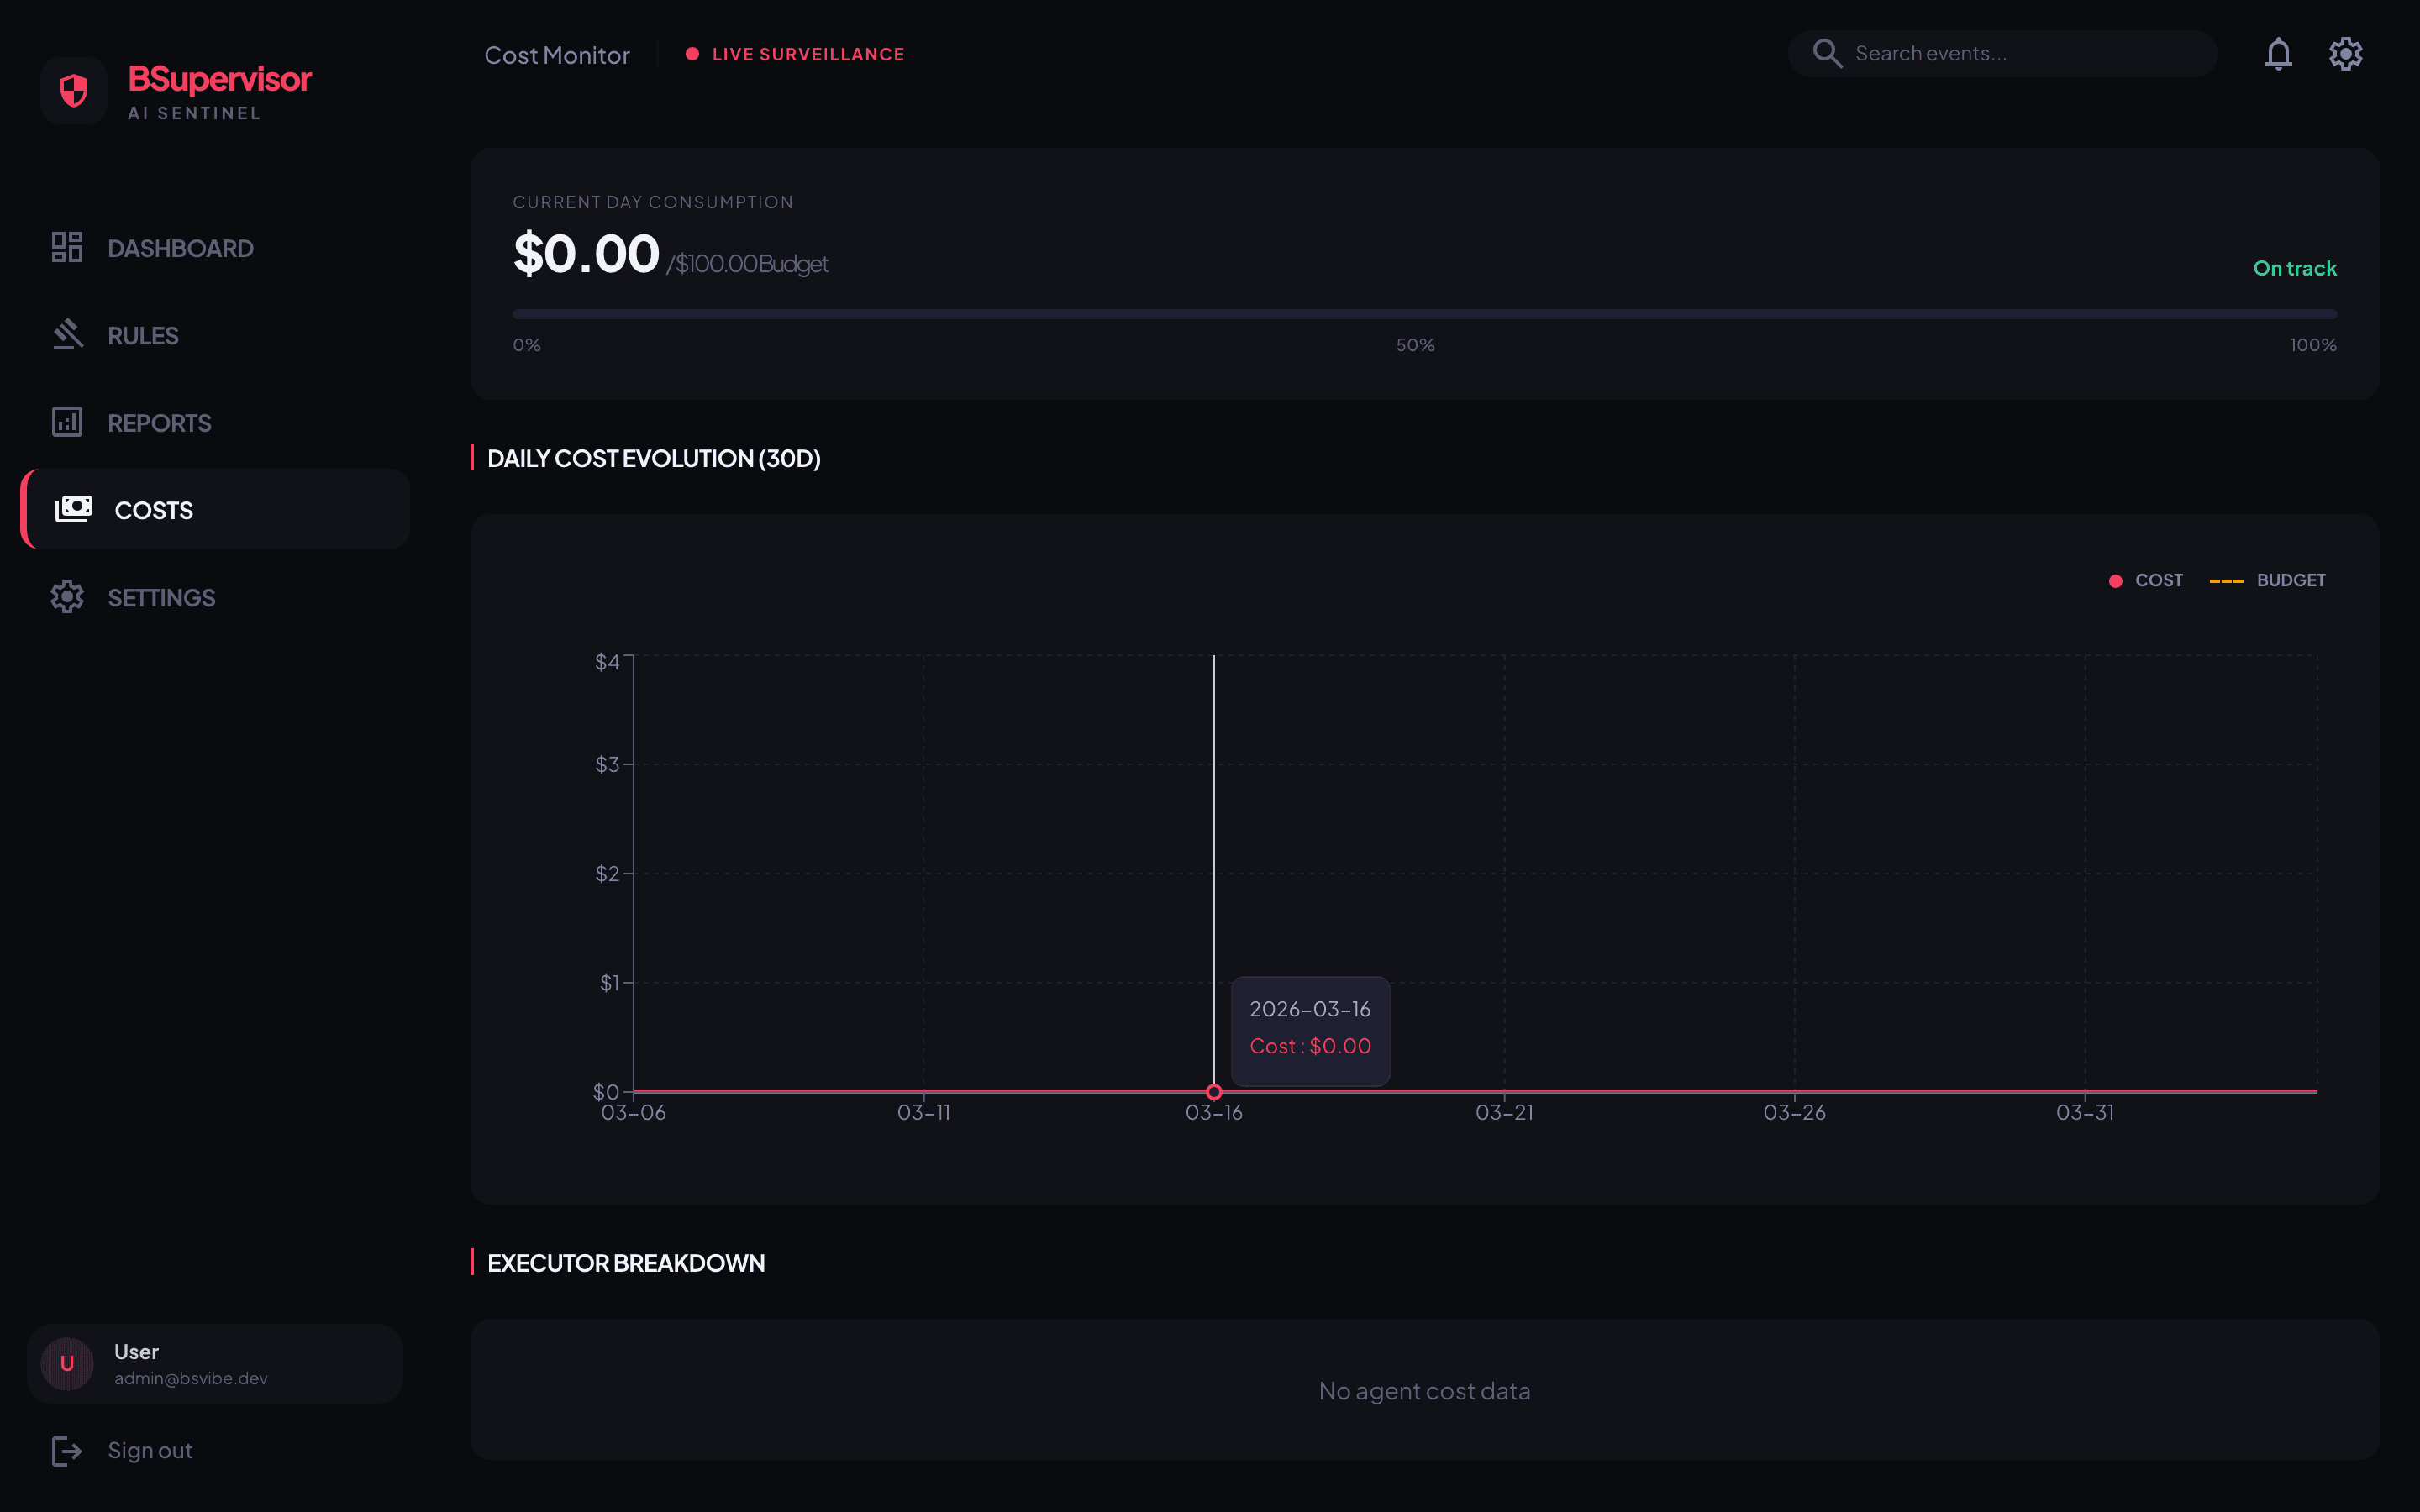
Once set up, monitor the following on the Dashboard in real time:
- Event timeline: Agent events sorted chronologically
- Violation chart: Daily/weekly violation trend graphs
- Cost trends: LLM cost charts per agent and per model
Next Steps
- Core Concepts — Understand event collection, the rule engine, and cost tracking architecture
- Rule Management — Detailed guide to creating and managing custom rules
Last updated on